C2SMART COVID-19 Data Dashboard

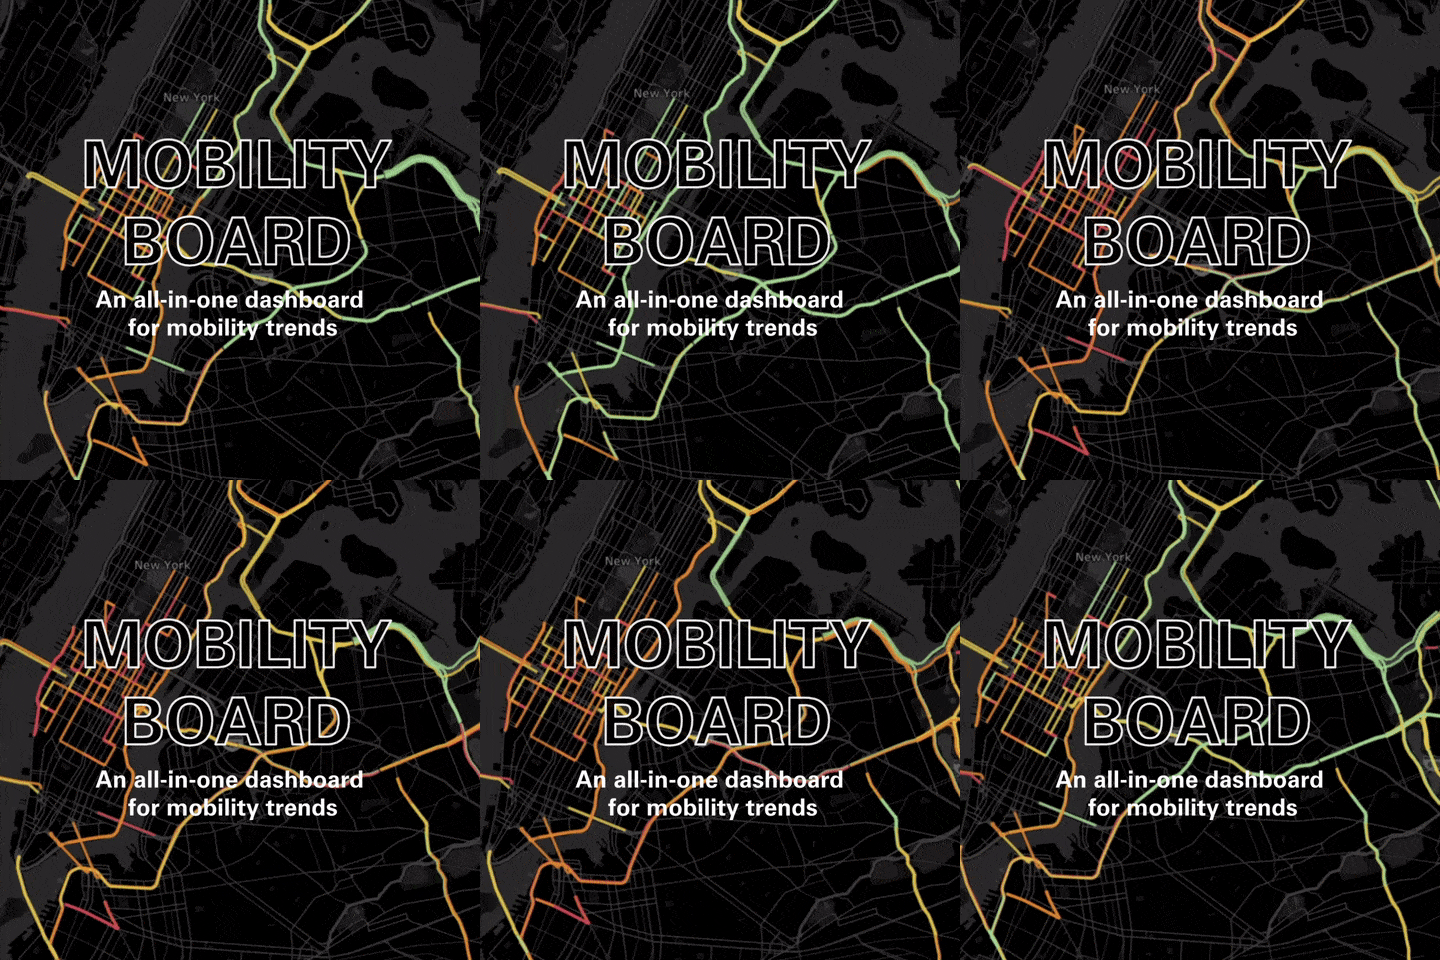
Welcome to the C2SMART COVID-19 Data Dashboard! This interactive data dashboard consolidates public data sources to track the mobility and sociability impact of the pandemic on transportation systems as it unfolds. This platform will update regularly and continue to evolve with the addition of new data, impact metrics, and visualizations.

Updates (For more information about the C2SMART COVID-19 Data Dashboard, please contact Jingqin Gao at: .):

  • NEW! – The subway ridership from four cities in China has been updated (5/11/2021)
  • NEW! – The yellow, green taxi and For-Hire Vehicle (FHV) trip-related data in 2020 has been updated
  • NEW! – Monthly Vehicular Traffic at Port Authority Tunnels and Bridges has been added
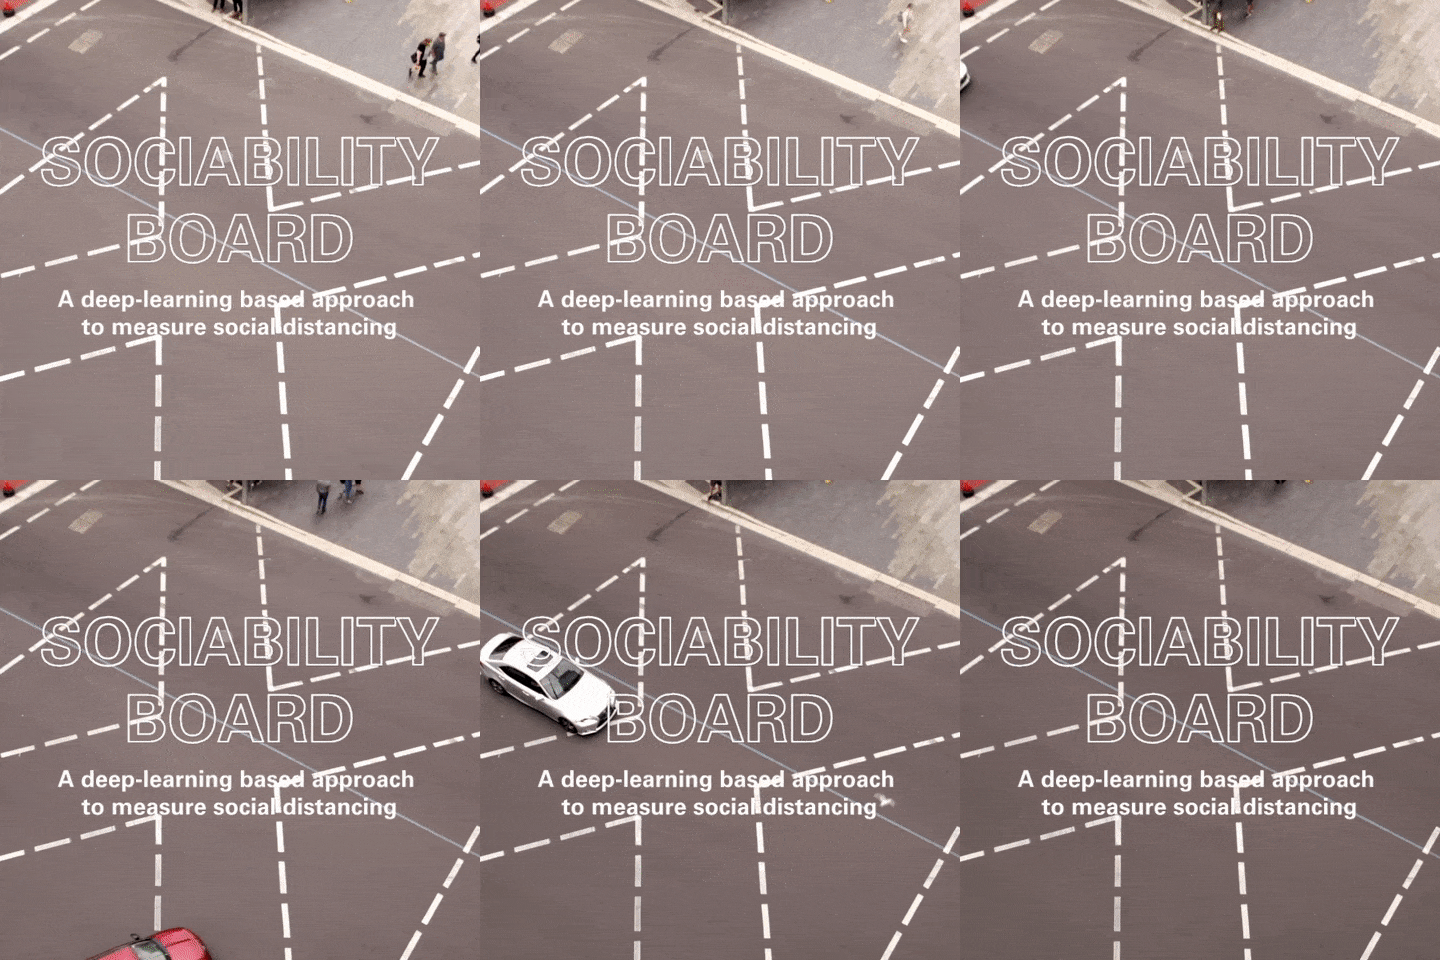
  • NEW! – Social Distancing Safety Rate and Temporal Distributions of Pedestrian, Car and Cyclist charts have been uploaded under “Sociability” Tab
  • Most of the data and aggregated statistics will be updated weekly and are open for download

Overview

The COVID-19 outbreak has dramatically changed travel behavior in cities across the world. With changed travel demand, economic activity, and social-distancing/stay-at-home policies, transportation systems have experienced an unprecedented shift in demand and usage. Since the start of the pandemic, the C2SMART research team has been collecting data and investigating the impact of COVID-19 on mobility and sociability, including:

  • Passenger travel and freight traffic trends
  • Mode shift and usage based on various policies
  • Effect of social distancing policies on transit use and emissions
  • Sidewalk, crosswalk, and intersection crowd density
  • Effect of COVID-19 Policies on Transportation Systems

Leveraging open data from multiple sources, this project features both traditional and innovative techniques,such as data mining and visualization, agent-based traffic simulation model and real-time computer vision technique, to help researchers and transportation authorities understand and observe the impact of the pandemic on transportation.

Webinars

Public Traffic Cams and Computer Vision to Analyze Social Distancing Trends

Developing C2SMART’s Interactive COVID-19 Data Dashboard

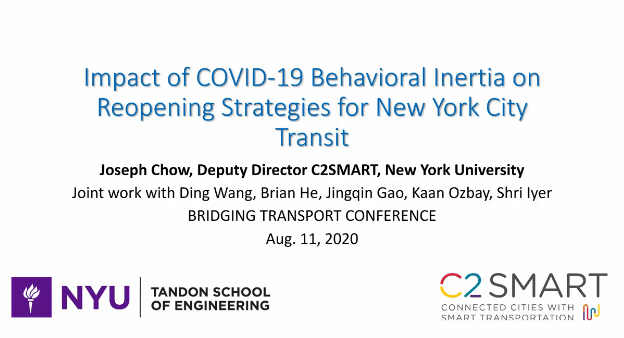
Impact of COVID-19 behavioral inertia on reopening strategies for New York City Transit

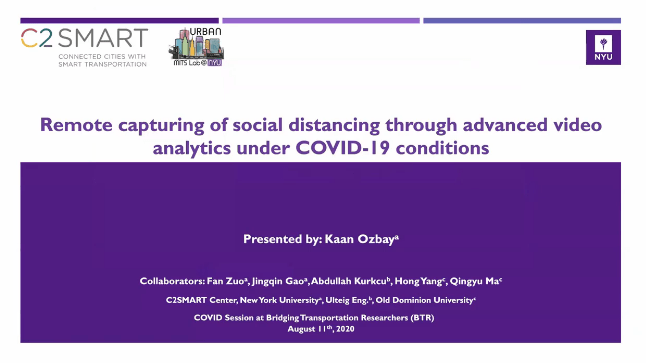
Remote Capturing of social distancing through advanced video analytics under COVID-19 conditions

Kaan Ozbay

Headshot of Kaan Ozbay

PRINCIPAL INVESTIGATOR

Joseph Chow

Joseph Chow headshot

CO-PRINCIPAL INVESTIGATOR

Jingqin Gao

Jingqin Gao

SENIOR RESEARCH ASSOCIATE

Zilin Bian

Black and white profile of a man wearing a dark colored sweater

GRADUATE RESEARCHER

Ding Wang

Ding Wang

GRADUATE RESEARCHER

Yueshuai He

Yueshuai He headshot

GRADUATE RESEARCHER

Fan Zuo

GRADUATE RESEARCHER

Suzana Duran Bernardes

GRADUATE RESEARCHER

Abhinav Bhattacharyya

Abhinav Bhattacharyya

GRADUATE RESEARCHER

Yubin Shen

Yubin Shen

RESEARCH ENGINEER

Siva Sooryaa Muruga Thambiran

UNDERGRADUATE RESEARCHER

Nicholas Hudanich

UNDERGRADUATE RESEARCHER

Omar Hammami

UNDERGRADUATE RESEARCHER

Murat Ledin Barlas

UNDERGRADUATE RESEARCHER

  • University of Washington (Jingxing Wang, Yanyan Chen, Sai Sarath Chandra Pavuluri Venkata, Xuegang (Jeff) Ban)
  • Rutgers University (Chaekuk Na, Hani Nassif)
  • Old Dominion University (Hong Yang, Qingyu Ma)
  • Cornell University (H. Oliver Gao, Mohammad Tayarani)
  • Ulteig (Abdullah Kurkcu)

Principal Investigator Kaan Ozbay, NYU
Funding Source C2SMART Center
Total Project Cost $50,000
USDOT Award # 69A3551747124
Start and End Dates 4/1/20 – 3/31/22
Implementation of Research Outcomes
Impacts/Benefits of Implementation
University of Washington logo